5.1.5. Gravity gradiometry observations: GIF file
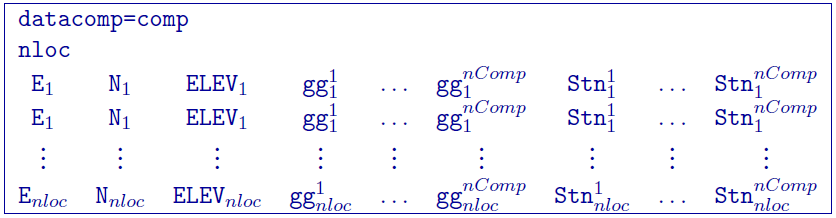
This file is used to specify the observation locations and observed gravity gradiometry anomalies with estimated standard deviation. The output of the forward modelling program ggfor3d has the same structure except that the column of standard deviations for the error is omitted. This data file is quite similar to the gravity data style except with a component header. Lines starting with ! are comments. The following is the GIF-formatted file structure of a gravity observations file:
Parameter definitions:
comp: Two-letter flag(s) for the data types: xx, xy, xz, yy, yz, zz. This is proceeded by the flag
datacomp=. Multiple components can be separated by anything, but must only take up one character (e.g., a comma or a space).nloc: Number of locations.
E, N, ELEV: Easting, northing, and elevation of the observation, measured in meters.
gg \(^{nComp}_i\): Anomalous (//(j^{th}//) component of the gravity gradient at the //(i^{th}//) location measured in Eotvos.
Stn \(^{nComp}_i\): Standard deviation of the (//(j^{th}//) component of the gravity gradient at the //(i^{th}//) location. It must be positive and non-zero.
NOTE: The program package assumes a density contrast distribution in g/cm \(^3\) with mesh cells in meters. Therefore, it is crucial that the data be prepared in Eotvos.
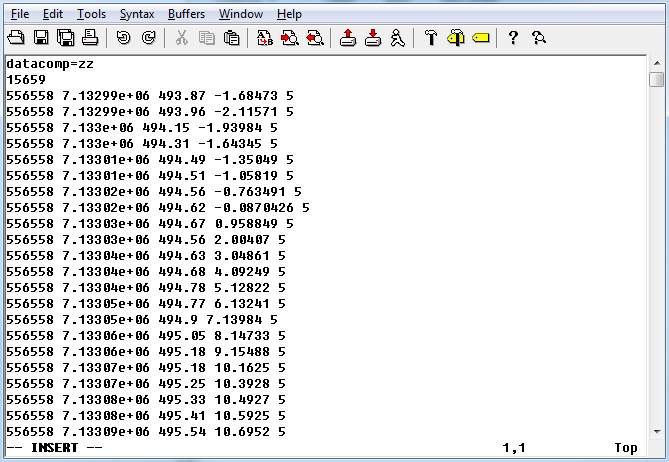
5.1.5.1. Example 1
Below is an example of observations of the vertical gradient only (Gzz):
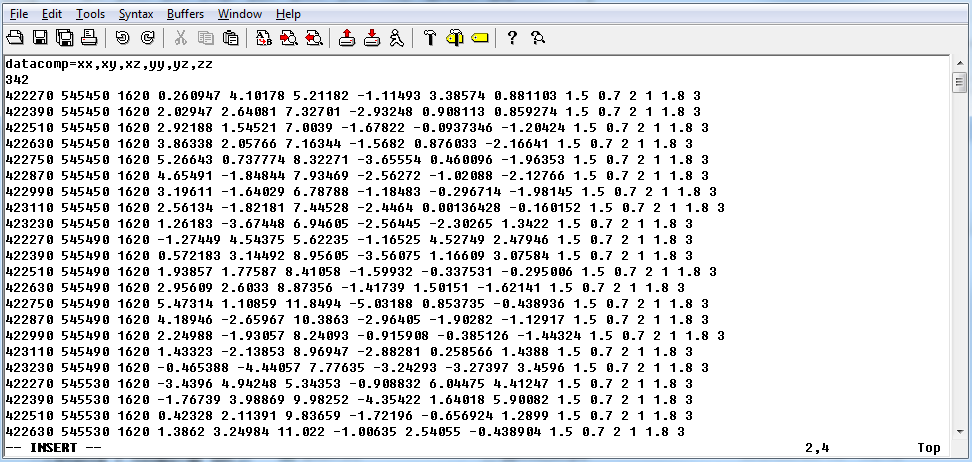
5.1.5.2. Example 2
Below is an example of the gravity gradient observations with all six components: